


Descubre folk el CRM para empresas impulsadas por personas.
Your sales team has a pipeline full of opportunities. Some buyers are ready to discuss pricing, while others have just booked a first call. How much revenue can you reasonably expect next quarter?
The answer depends on more than the total value of those deals. You also need to consider how likely they are to close, how long your sales cycle takes, and whether past results still reflect current conditions.
Different methods of sales forecasting use different information to make those estimates. Some rely on historical sales or pipeline data; others draw on the experience of your sales team or insights from buyers.
This guide covers eight sales forecasting methods, with examples, strengths, and limitations to help you choose an approach that fits your business.
📌 Sales Forecasting Methods: Article Overview
- Sales forecasting methods help businesses estimate future sales over a defined period.
- Quantitative methods use numerical data, such as past sales, deal values, and conversion rates. Qualitative methods rely mainly on judgment, experience, and market insights.
- The right method depends on what you want to forecast, the data you have, and how your sales process works.
- Comparing methods can reveal differences in your assumptions and help you investigate unexpected results.
- A useful forecast depends on accurate data and regular reviews. Compare predictions with actual results to improve future estimates.
What Are Sales Forecasting Methods?
Sales forecasting methods are approaches businesses use to estimate future sales over a specific period. They draw on information such as historical results, current opportunities, market research, and the experience of sales teams.
A forecast can estimate different outcomes. Depending on your business and planning needs, you might predict:
→ Sales volume: The number of products, services, or deals you expect to sell.
→ Contract value: The value of deals you expect to sign during a given period.
→ Revenue: The revenue you expect to generate or recognize during that period.
Choose the outcome and timeframe before you start. A forecast of contracts signed next quarter, for example, won’t necessarily match the revenue recognized during that same quarter.
Important to know: A sales forecast also differs from a sales target. A target is what your team aims to achieve; a forecast is your estimate of what it expects to achieve based on the information available. Both help with planning, but they serve different purposes.
Qualitative vs. Quantitative Sales Forecasting Methods
Sales forecasting methods generally fall into two categories: qualitative and quantitative. The difference lies in the information they use to produce an estimate.
1. Qualitative Sales Forecasting
Qualitative forecasting relies mainly on human judgment and market insights. A company might ask its sales reps to estimate which deals will close, interview potential buyers, or consult industry experts.
This approach is useful when historical data is limited or less relevant—for example, when launching a new product or entering a new market. Its main limitation is that estimates depend on people’s knowledge and assumptions, which can introduce bias.
2. Quantitative Sales Forecasting
Quantitative forecasting uses numerical data to estimate future sales. Depending on the method, that data may include past revenue, the value of open deals, conversion rates, or the average length of a sales cycle.
This approach works best when you have enough reliable, comparable data to identify patterns. However, past performance doesn’t always reflect changes in buyer behavior, market conditions, or your sales process.
💡 folk CRM tip: You can also combine both approaches. For example, a sales manager might start with a pipeline-based forecast, then review it with reps to account for information the numbers don’t yet show, such as a buyer postponing a decision.
8 Methods of Sales Forecasting
The best sales forecasting method depends on what you need to predict and the information available. Here are eight approaches, with examples to help you understand how each one works.
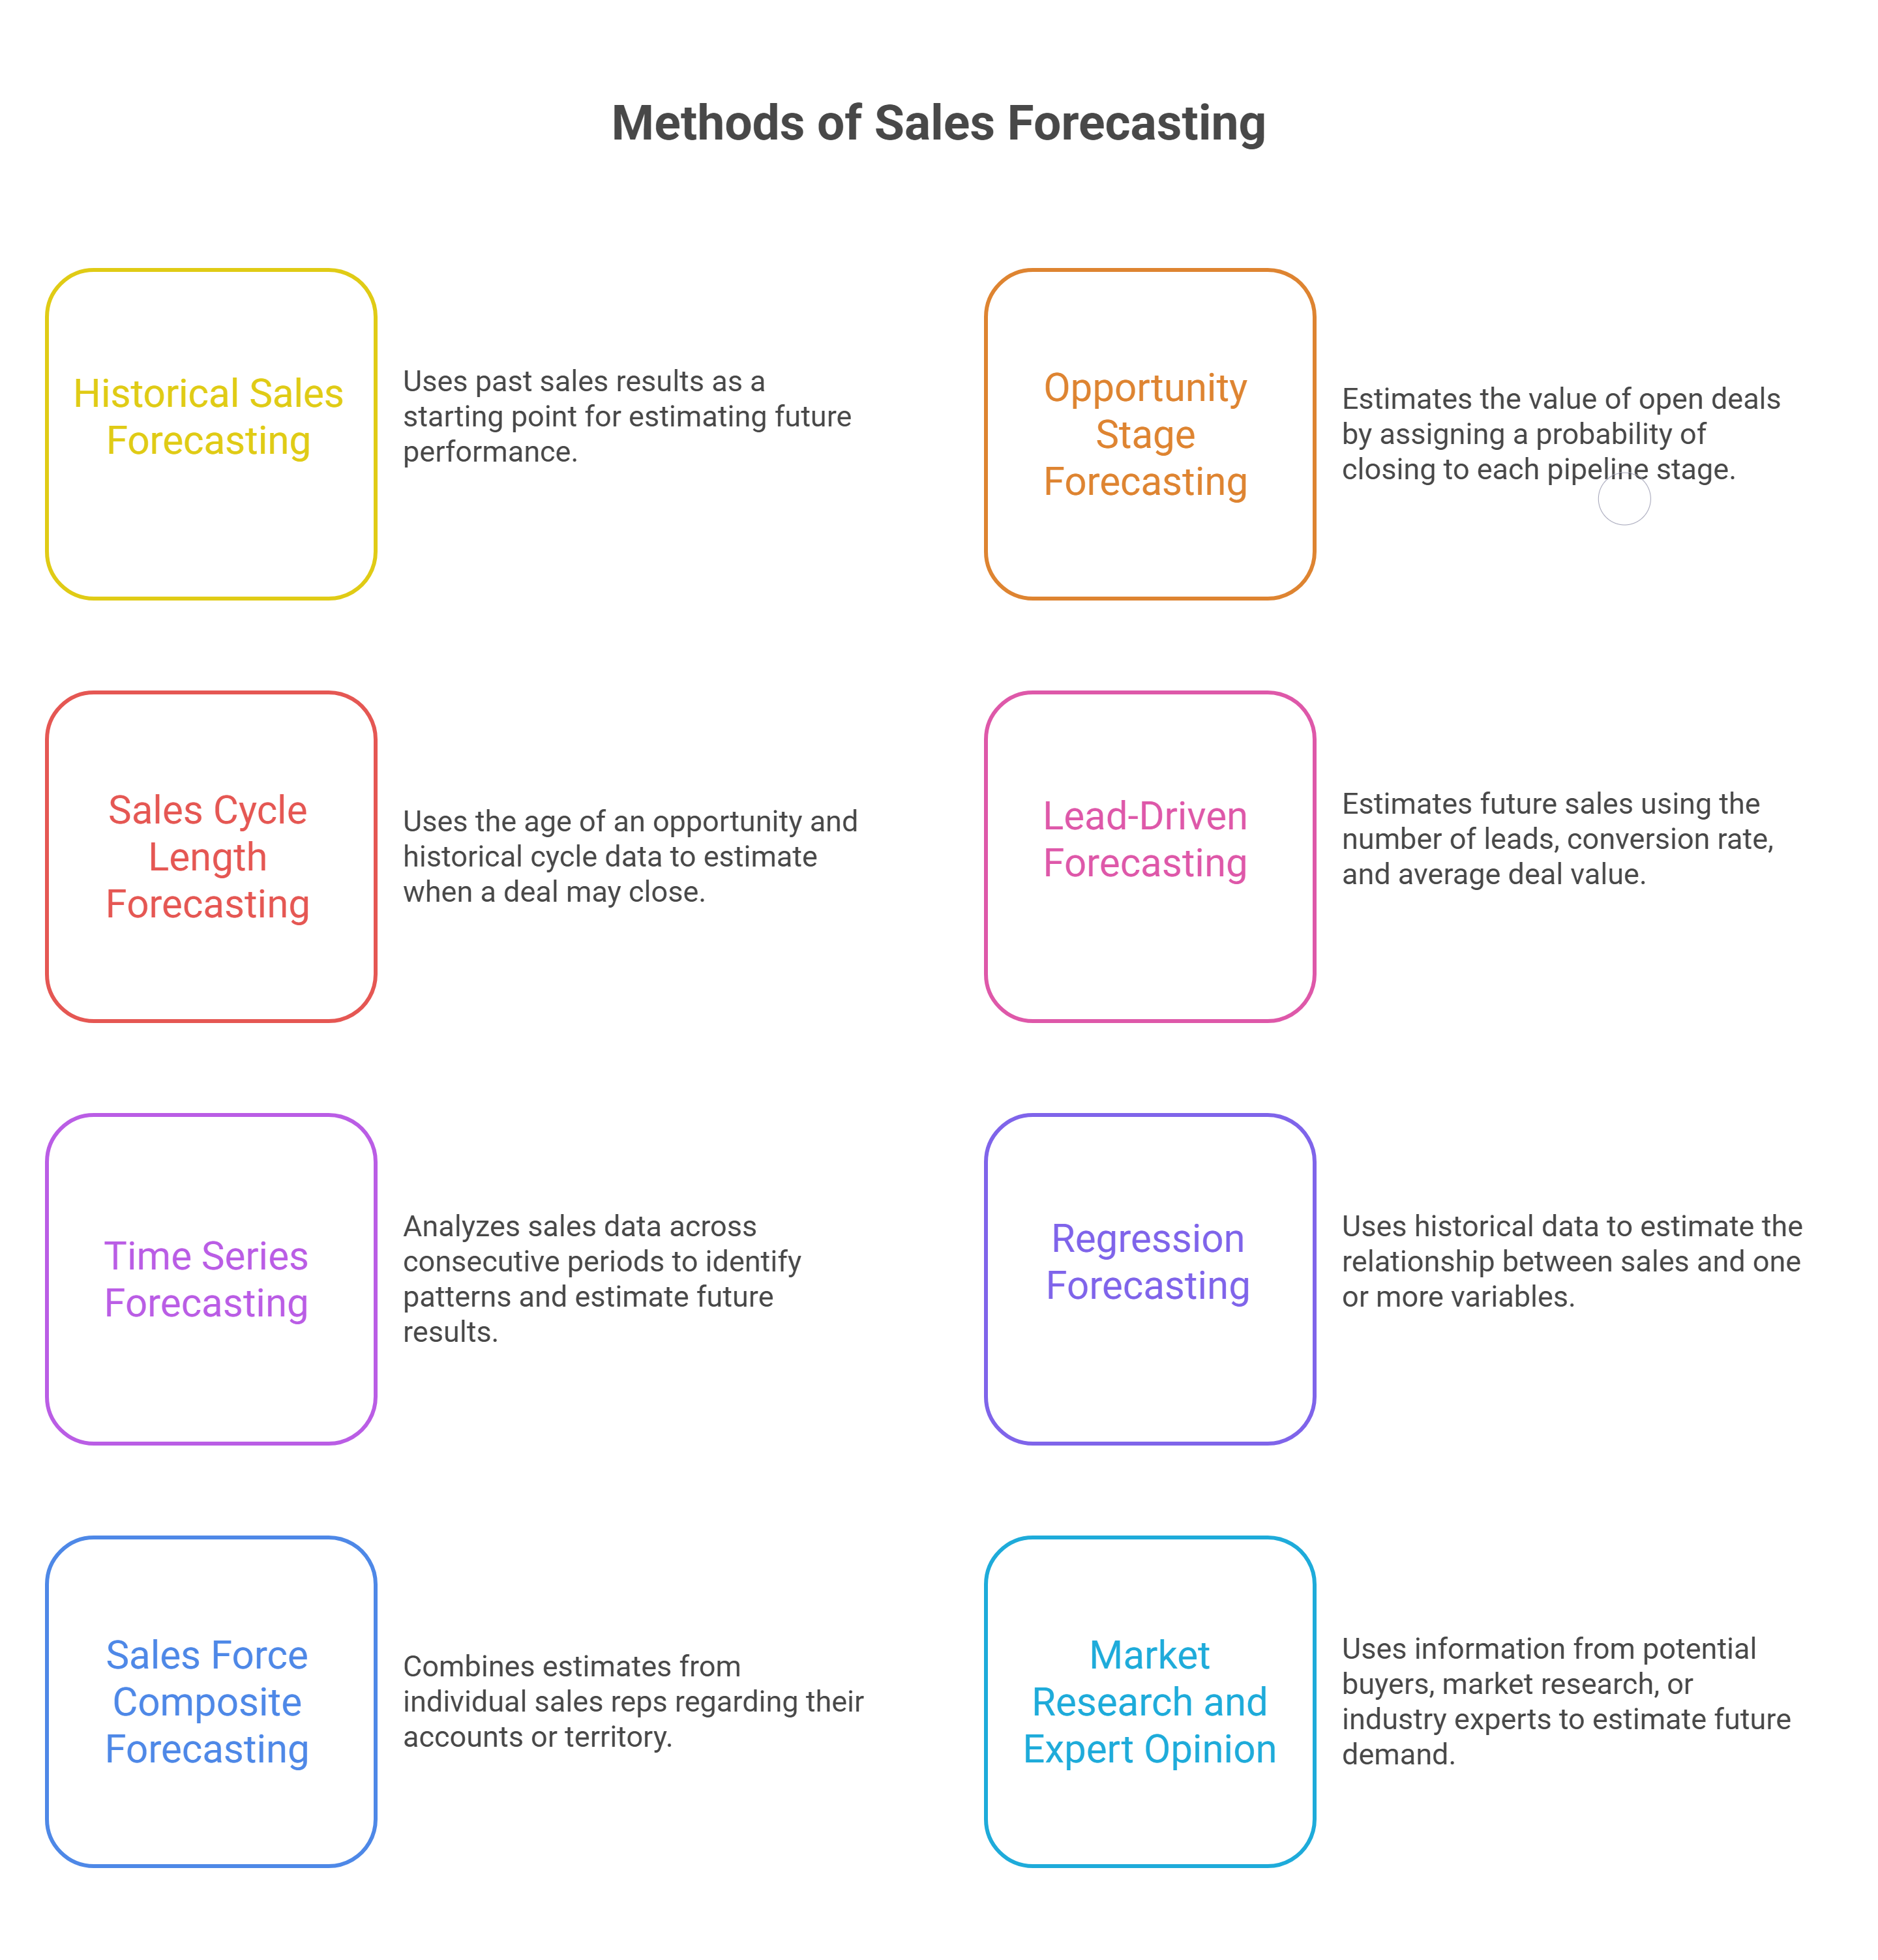
1. Historical Sales Forecasting
Historical sales forecasting uses past sales results as a starting point for estimating future performance. You can use a previous period’s results as they are or adjust them based on a documented growth assumption.
Example: Your company signs $100,000 in new contracts in Q1. If you expect sales to grow by 10% in the following Q1, your estimate is:
$100,000 × 1.10 = $110,000
✔️ Best for: Businesses with consistent sales patterns and reliable historical data.
❗ Main limitation: Past results don’t automatically account for changes in pricing, market demand, team capacity, or competition. A growth assumption also needs a sound basis; adding 10% simply because it’s your target can make the forecast misleading.
2. Opportunity Stage Forecasting
Opportunity stage forecasting estimates the value of open deals by assigning a probability of closing to each stage of your sales pipeline. You multiply each deal’s value by its stage probability, then add the results.
Example: Two opportunities are expected to close this quarter:
- A $10,000 deal at a stage with a 40% historical win rate: $10,000 × 40% = $4,000.
- A $20,000 deal at a stage with a 60% historical win rate: $20,000 × 60% = $12,000.
The combined weighted forecast is $16,000.
✔️ Best for: Teams with clearly defined pipeline stages and enough historical data to estimate win rates.
❗ Main limitation: The forecast treats deals at the same stage similarly, even when their circumstances differ. Also, a stage-to-win rate doesn’t necessarily represent the chance of closing within the forecast period. Check expected close dates and historical timing separately.
The $16,000 is a combined expected value, not a guarantee that either deal will close or that the team will sign exactly that amount.
3. Sales Cycle Length Forecasting
Sales cycle length forecasting uses the age of an opportunity and historical cycle data to estimate when a deal may close. It can help teams assess whether expected close dates align with how long similar deals typically take.
Example: Your team’s comparable deals take around 90 days to close. A new opportunity has been open for 30 days, and the rep expects it to close next week. The historical timeline gives the manager a reason to discuss that estimate with the rep.
✔️ Best for: Teams that track opportunity creation and close dates consistently.
❗ Main limitation: Deal age alone doesn’t determine whether an opportunity will close. Larger deals, different customer segments, or delays in the buying process can change the timeline. Use comparable historical deals and review the buyer’s actual progress alongside the numbers.
4. Lead-Driven Forecasting
Lead-driven forecasting estimates future sales using the number of leads you expect, their conversion rate, and the average value of a closed deal.
Example: You expect to generate 200 leads from a channel. Historically, 10% become customers, with an average deal value of $5,000:
200 leads × 10% × $5,000 = $100,000
This gives you an estimated $100,000 in contract value from that group of leads.
✔️ Best for: Businesses with reliable lead volume and conversion data, especially when planning around lead generation campaigns.
❗ Main limitation: The estimate applies to the lead group, not necessarily to the quarter in which those leads arrive. If customers typically take several months to buy, some sales may close in a later period. Conversion rates and deal values can also differ by source or segment.
5. Time Series Forecasting
Time series forecasting analyzes sales data across consecutive periods to identify patterns and estimate future results. Depending on the model, it can account for trends or seasonality.
A simple approach is a moving average, which uses the average of several recent periods as a baseline.
Example: Your team signs $80,000 in January, $100,000 in February, and $90,000 in March:
($80,000 + $100,000 + $90,000) ÷ 3 = $90,000
The three-month moving average gives you a $90,000 baseline for April.
✔️ Best for: Businesses with consistent sales records across multiple periods.
❗ Main limitation: A simple moving average smooths out fluctuations but doesn’t automatically account for trends, seasonal changes, or upcoming events. The more complex the pattern, the more carefully you need to select and test the model.
6. Regression Forecasting
Regression forecasting uses historical data to estimate the relationship between sales and one or more variables, such as lead volume, advertising spend, or seasonality. The resulting model can help estimate sales when those variables change.
Example: A company analyzes monthly lead volume and closed sales over two years. It builds a regression model, then uses its expected lead volume to estimate future sales.
✔️ Best for: Teams with enough reliable data and the analytical resources to build and test a model.
❗ Main limitation: A relationship observed in historical data may not hold in the future. Correlation also doesn’t prove that one variable causes a change in sales. Test the model against periods it wasn’t built on and review its assumptions before using it for planning.
7. Sales Force Composite Forecasting
Sales force composite forecasting combines estimates from individual sales reps. Each rep reviews their accounts or territory, predicts what they expect to close, and shares that estimate with their manager. The manager then reviews and combines the submissions.
Example: Four reps estimate they’ll close $40,000, $30,000, $50,000, and $25,000 in new contracts next quarter. Their combined estimate is $145,000.
✔️ Best for: Teams whose reps have direct knowledge of active opportunities and buyer conversations.
❗ Main limitation: Estimates can reflect individual optimism, caution, or inconsistent criteria. Review them against deal evidence and historical results before accepting the combined figure as your forecast.
8. Market Research and Expert Opinion Forecasting
This method uses information from potential buyers, market research, or industry experts to estimate future demand. It can be useful when your company has little historical data for a product or market.
One structured approach is the Delphi method: experts give estimates independently over several rounds, review an anonymous summary of the group’s responses, and have an opportunity to revise their views.
Example: Before launching a new service, a company interviews potential customers about their needs and buying plans. It combines their responses with expert estimates to develop a range of possible sales outcomes.
✔️ Best for: New products, new markets, or situations where past sales provide limited guidance.
❗ Main limitation: What buyers say they intend to purchase may differ from what they actually buy. Expert estimates also depend on the quality of the information and assumptions available.
Sales Forecasting Methods: A Quick Comparison
Use this comparison to identify which methods fit the data your team has and the questions you need to answer.
How to Choose the Right Sales Forecasting Method: 5 Steps
A method that works for an established sales team may not suit a company launching its first product. Before choosing an approach, consider what you need to predict and which information you can trust.
Step 1. Define What You Want to Forecast
Start with a specific question. Do you need to estimate the number of deals your team will close next month, the value of contracts signed this quarter, or revenue over the next year?
Your answer determines which data and methods are relevant. For example, opportunity stage forecasting can help estimate the value of deals expected to close in an upcoming quarter. Market research may be more useful when estimating demand for a product that hasn’t launched yet.
Step 2. Assess the Data You Have
Review the information available to your team and check whether it’s complete enough to support your chosen method.
→ Reliable past sales data? Historical or time series forecasting gives you a starting point.
→ A well-maintained pipeline and historical win rates? Opportunity stage forecasting may be a good fit.
→ Lead volumes, conversion rates, and average deal values? Consider a lead-driven forecast.
→ Limited internal data? Sales rep estimates, customer research, or expert input can help you build an initial forecast.
The amount of data matters, but so does its relevance. Results from an old sales process or a different customer segment may not provide a useful comparison.
Step 3. Consider Your Sales Cycle
The length and complexity of your sales cycle affect how you interpret the data. If most deals take six months to close, leads generated this month are unlikely to produce all their sales next month.
Look at differences between deal types, too. Enterprise opportunities may involve more stakeholders and take longer than smaller transactions. Separate forecasts by segment when those differences affect the results.
Your sales pipeline can help you review where opportunities stand and identify deals that need attention before the forecast period ends.
Step 4. Account for Changes That Affect Sales
Historical figures provide context, but they don’t capture every change ahead. Before applying a past growth rate or conversion rate, consider whether anything has changed:
- Has your pricing or product offering changed?
- Is your team entering a new market?
- Are you hiring sales reps or reducing capacity?
- Does demand fluctuate at certain times of year?
- Are customers taking longer to make decisions?
Document the changes you expect and explain how they affect your assumptions. If their impact is uncertain, build a range of scenarios instead of presenting one estimate as a certainty.
Step 5. Compare More Than One Method
Two methods can give you different views of the same period. For example, a historical forecast might suggest $200,000 in new contracts next quarter, while an opportunity stage forecast estimates $150,000 from the current pipeline.
Investigate the gap. Your pipeline may be smaller than it was last year, or some opportunities may not yet be recorded. Comparing the assumptions helps you decide which estimate better reflects the current situation.
💡 folk CRM tip: Add custom fields for deal value and expected close date, then track each opportunity’s stage and owner in a shared pipeline. Before building your forecast, review missing or outdated information with the responsible rep. Your team has a more consistent starting point for its calculations.
Common Sales Forecasting Mistakes to Avoid
Even a suitable forecasting method can produce a misleading estimate if the data or assumptions behind it are unreliable. Watch for these common mistakes:
❌ Treating your sales target as your forecast → A goal gives your team something to work toward. Your forecast should reflect what current evidence suggests is likely, even when that number falls short of the target.
❌ Using outdated deal information → A pipeline full of old close dates and inactive opportunities can inflate your forecast. Ask reps to review their deals and update records when the buyer’s plans change.
❌ Guessing stage probabilities → A “proposal” stage doesn’t automatically mean every deal has a 70% chance of closing. Use your own historical results where available, and review whether those rates still reflect your current process.
❌ Applying one conversion rate to every lead → Leads from referrals, outbound campaigns, and paid ads may convert at different rates. Segment your data when you have enough historical information to make a meaningful comparison.
❌ Ignoring the length of the sales cycle → A lead generated this month may not become a customer for several months. Factor in the time between lead creation and closing when assigning expected sales to a forecast period.
❌ Comparing different metrics → A forecast of contracts signed in a quarter isn’t necessarily comparable to revenue recognized in that quarter. Define the metric and period consistently before measuring the gap.
❌ Leaving the forecast unchanged → New information can alter an opportunity’s value or timing. Review your forecast regularly and update it when the evidence changes.
Keep Your Sales Forecast Grounded in Real Data With folk CRM
⭐⭐⭐⭐⭐ (G2)
A sales forecast is only as useful as the information behind it. If deal values are missing, close dates are outdated, or buyer conversations sit in individual inboxes, your team has to spend time piecing the picture together.
folk’s Sales CRM gives your team a shared place to organize opportunities, review buyer context, and track the data you need for forecasting.
With folk, you can:
✅ Track opportunities in a shared pipeline: See where deals stand and review their progress across your sales pipeline.
✅ Record deal details: Use custom fields to capture values, expected close dates, and other information your team needs.
✅ Keep buyer context together: Review shared notes and interactions before discussing a deal’s likelihood or timing.
✅ Monitor sales performance: Build customizable dashboards to follow deal values, closed sales, and other relevant metrics.
✅ Coordinate next steps: Assign tasks and keep follow-ups visible to the people responsible.
Bring your team’s deal information together in folk, then use it to build and review forecasts based on a clearer view of your pipeline.
👉 Try folk CRM free for 14 days
Conclusión
The right sales forecasting method depends on what you want to predict and the information you have. Historical data can give you a useful baseline, while pipeline data and sales rep insights help you account for current opportunities.
Start with a method your team can support with reliable data. Document your assumptions, review the forecast as deals progress, and compare it with actual results. Each review gives you a better understanding of what drives the gap—and a stronger basis for your next forecast.
Preguntas frecuentes
What Are the Main Methods of Sales Forecasting?
Common methods include historical forecasting, opportunity stage forecasting, sales cycle length forecasting, lead-driven forecasting, time series analysis, regression, sales force estimates, and market research. Each uses different inputs and suits different planning needs.
What Is the Difference Between Qualitative and Quantitative Sales Forecasting?
Qualitative forecasting relies mainly on judgment and insights from sales reps, buyers, or experts. Quantitative forecasting uses numerical data, such as past sales, deal values, and conversion rates. Many teams combine both to account for information that numbers alone may not show.
Which Sales Forecasting Method Is Best for a Small Business?
It depends on the business’s sales process and available data. A small business with consistent past sales might start with historical forecasting. One with an active pipeline can use opportunity stage forecasting, while a new business may rely more on customer research and sales team estimates.
How Can a New Business Forecast Sales Without Historical Data?
A new business can use market research, buyer interviews, expert opinions, and estimates based on its expected sales capacity. Document the assumptions behind each estimate, then replace or refine them as actual sales data becomes available.
How Often Should You Update a Sales Forecast?
Review forecasts regularly and update them when relevant information changes. Teams with active pipelines may review their forecasts weekly, while broader planning forecasts may follow a monthly or quarterly schedule. The right cadence depends on your sales cycle and planning needs.
How Do You Measure Sales Forecast Accuracy?
Compare the forecast with the actual result for the same metric and period. One way to express the difference is:
Forecast error (%) = |forecast − actual result| ÷ actual result × 100
For example, if you forecast $200,000 in contracts and sign $160,000, the absolute error is 25% of the actual result. If the actual result is zero, this percentage can’t be calculated; review the difference as a dollar amount instead.
Can a CRM Help With Sales Forecasting?
Yes. A CRM helps teams organize the information used in a forecast, including deal values, pipeline stages, expected close dates, and buyer interactions. It also gives managers a shared view of opportunities to review with reps before updating their estimates.
Te presentamos « folk », el CRM basado en IA para todo tu proceso de ventas.